
RodHat's Tips From the Console
Next-level shit. Not "here's how to ls -la."
Need the version number, not the essay?→ Syscall reference
cachestat(2): querying the page cache without mmap
Since Linux 2.3.99, mincore(2) has been the only way to ask which pages of a file are resident. It requires mmap first, and it only answers resident/not-resident. cachestat(2), added in Linux 6.5, fixes both problems. Here is the actual interface and when you want it.
setns and unshare: moving between Linux namespaces
Every container runtime in existence calls setns(2) and unshare(2). These two syscalls are how Linux carves off namespaced views of mounts, PIDs, networking, and hostnames. Here is what they actually do and where they will surprise you.
pkey_mprotect: in-process memory isolation without a syscall
Linux 4.8 added memory protection keys (MPK): a hardware mechanism on x86 that lets you partition process memory into up to 16 independently-gated domains and flip their permissions via a single WRPKRU instruction, no kernel round-trip required. Here is how it works and where it bites you.
clone3: fork a process and get a stable handle in the same syscall
clone(2) is 30 years old and its calling convention is different on every architecture. clone3(2) landed in Linux 5.3 with a struct-based API and CLONE_PIDFD, which hands you a race-free process handle at fork time. Here is how to use it.
rseq: per-CPU data without a kernel call
Linux 4.18 added rseq(2), the restartable sequences interface. glibc 2.35 uses it so malloc can pick an arena without getcpu(2). Here is how the critical-section mechanism works, what glibc exposes, and why musl ignores it.
copy_file_range: file-to-file copies that never leave the kernel
Linux 4.5 added copy_file_range(2), the missing piece between splice and sendfile. It copies between two file descriptors entirely inside the kernel, with server-side offload on NFS 4.2 and reflink on btrfs. No pipe required, no userspace buffer, no read/write loop.
process_madvise: memory pressure hints across process boundaries
Linux 5.10 added process_madvise(2), the cross-process counterpart to madvise(2). You pass a pidfd and an iovec of address ranges in the target process and advise MADV_COLD, MADV_PAGEOUT, MADV_WILLNEED, or MADV_COLLAPSE. Android's LMKD uses it to reclaim memory before killing. You can use it to pre-freeze a process before CRIU checkpoint.
MADV_FREE and the RSS number that's lying to you
Since jemalloc 4.x, freed memory goes back to the OS with MADV_FREE instead of MADV_DONTNEED. Pages stay mapped, RSS stays inflated, and your monitoring is reading the wrong number. The fix is in /proc/pid/smaps_rollup.
io_uring's attack surface and IORING_REGISTER_RESTRICTIONS
io_uring has been a CVE factory since it shipped in Linux 5.1. IORING_REGISTER_RESTRICTIONS locks down what a ring instance can do, but it only works if you apply it before handing the fd to untrusted code. Here is the actual API.
The kernel keyring has been in Linux since 2.6.10 and you have never used it
Linux has carried a proper in-kernel secret store since 2004. Typed keys, TTLs, permission bits, a search hierarchy that handles fork and exec correctly. Most services store secrets in environment variables instead and wonder why they leak.
Linux capabilities: what the five sets actually do
Linux capabilities split root privilege into 40-odd discrete bits organized across five per-thread sets. Most guides explain the names. This one explains the exec transformation rules, why ambient capabilities (Linux 4.3) matter, and how to drop caps correctly so they stay dropped.

prctl: the per-process security levers worth knowing
PR_SET_NO_NEW_PRIVS prevents exec from granting new privileges regardless of the binary's setuid bits. PR_SET_DUMPABLE locks /proc/PID from outside readers. PR_SET_PDEATHSIG cleans up orphans when a supervisor dies. Three prctl calls that belong in every daemon that drops privileges.
memfd_secret: memory the kernel itself cannot read
mlock keeps secrets out of swap. memfd_secret goes further by removing the pages from the kernel's direct map entirely. No kernel module, no ptrace, no /proc/kcore can reach them. The tax is TLB pressure, which is why some distros ship it disabled.

mlock, MADV_DONTDUMP, and where your secrets actually leak
You zero the key buffer before free. The compiler deletes it. You call mlock but hit ENOMEM and ignore it. The coredump ships the private key to your crash reporter. Here is how memory hygiene for secret material actually works on Linux.
getrandom(2) without the syscall: what Linux 6.11 finally shipped
Linux 6.11 added getrandom(2) to the vDSO. The kernel shares RNG state with userspace, ChaCha20 runs in the process, and the syscall disappears from hot paths. BSD got here in the 1990s.

pledge(2) and unveil(2): what OpenBSD figured out that Linux is still catching up to
OpenBSD shipped two syscalls in 2016 and 2018 that let any unprivileged daemon sandbox itself down to exactly the filesystem paths and syscall categories it needs. Linux got there eventually, with seccomp-bpf in 2012, Landlock in 2021, and namespaces throughout. Compare and decide which one you'd rather write.

openat2(2): path resolution you can actually trust
Linux 5.6 shipped openat2(2) with RESOLVE_BENEATH and RESOLVE_IN_ROOT. You can now open files inside a directory tree without root, without chroot, and without the symlink races that have been eating archive extractors for thirty years.

statx(2): what stat(2) should have been
stat(2) is forty years old and it shows. No birth time, no way to ask for only what you need, no inode attribute flags. Linux 4.11 shipped statx(2). Almost nobody uses it. Here is what it can do.

The new mount API: fsopen(2), fsmount(2), and doing it right
Linux 5.2 shipped a replacement for the forty-year-old mount(2) syscall. The new interface is fd-based, composable, and lets you configure a filesystem before committing the mount. Almost nobody uses it. Here is what it looks like.

fanotify(7): watch and block file opens at the VFS layer
fanotify has been usable since Linux 2.6.37 and is how file integrity monitors and endpoint-detection daemons actually hook into the VFS. Unlike inotify, it hands you an open fd to the accessed file and can block opens before the calling process gets control. Here is the API and a working example.

futex(2): the syscall your mutex is too polite to mention
pthread_mutex_lock is a polite wrapper over a brutal two-operation kernel interface. Here is how futex(2) actually works, how to build a correct mutex with it, and why FUTEX_REQUEUE exists to prevent pthread_cond_broadcast from being a thundering herd.

timerfd, signalfd, eventfd: every event source is a file descriptor now
Linux 2.6 added three syscalls that turn timers, signals, and counters into readable file descriptors. The self-pipe trick can finally die. Here is the correct way to fold timers and signals into an epoll loop without writing a single signal handler.

SO_REUSEPORT: each worker gets its own accept queue, and then the migration problem hits
Linux 3.9 added SO_REUSEPORT. Bind N sockets to the same address:port, the kernel hashes connections across them. Linux 4.5 (UDP) and 4.6 (TCP) added eBPF dispatch so you control the routing. The part nobody explains is what happens when one of those sockets disappears while connections are in flight.

SCM_RIGHTS: send an open file descriptor to another process over a Unix socket
You can pass a live, open file descriptor to another process via Unix domain socket ancillary data. Not a path, not a number — the actual kernel file description, with whatever offset and flags it already has. The mechanism is POSIX, predates Linux, and almost nobody uses it directly.
splice and tee: zero-copy data movement, 2.6.17 edition
splice(2) and tee(2) have been in Linux since 2006. They move data through the kernel page cache without a userspace copy. How to use them for log fanout, network sends, and pipeline work that does not belong in the era of read/write loops.

close_range: one syscall instead of a million EBADFs
Linux 5.9 finally shipped what FreeBSD had since 8.0. close_range() closes or cloexec-marks a range of file descriptors atomically. The old pre-exec fd cleanup loop burning a million close() calls is dead. Here is how to use it.

landlock: sandbox your process without root
Since Linux 5.13, landlock lets an unprivileged process restrict its own filesystem and network access using three new syscalls. No SELinux policy, no AppArmor profile, no root. Chrome uses it for renderer isolation. Here is how to wire it up.
userfaultfd: handle your own page faults from userspace
Since Linux 4.3, userfaultfd() lets a dedicated handler thread intercept page faults on registered memory regions and supply the missing pages before the faulting thread resumes. CRIU uses it for post-copy restore. QEMU uses it for live migration. You can use it to build demand-paged memory backed by anything.

memfd_create and file sealing: an anonymous file nobody can modify (including you)
memfd_create() gives you a file descriptor backed by anonymous memory, with no filesystem, no path, no name. Add F_SEAL_WRITE and the kernel refuses all future write access. Pass it across process boundaries via SCM_RIGHTS or pidfd_getfd. It's the right way to share immutable data between processes.

pidfd: Unix finally has a handle on your processes (only took 50 years)
Since Linux 5.3, pidfd_open() returns a file descriptor that refers to a specific process, not a PID number. File descriptors don't get recycled. The race you've been papering over with SIGCHLD handlers for decades is now actually fixable.

io_uring: why Jens Axboe's ring buffer is annoying to disagree with
io_uring landed in Linux 5.1 with a deceptively simple idea, two lock-free ring buffers shared between kernel and userspace. No syscall per operation. Zero copy. You can hate how many CVEs it's generated and still use it correctly. Here's the model.

Your process doesn't need 400 syscalls. seccomp-BPF lets you say so.
seccomp-BPF loads a classic BPF filter into the kernel that runs on every syscall your process makes. Give it a whitelist, everything else gets EPERM or SIGKILL. Here's how the filter model works, how libseccomp makes it tolerable, and how to audit what a real binary actually needs.

cgroups v2 is just files. Here's how to use them without touching systemd.
Linux cgroups v2 exposes memory, CPU, and I/O limits through a plain filesystem interface under /sys/fs/cgroup/. No systemd, no container runtime, just write to files and read the results. Here's the real workflow for memory.max, cpu.max, freezer, and io.max.
ftrace has been on your machine since 2.6.27. Here's how to actually use it.
ftrace is Linux's built-in kernel function tracer, accessible directly via /sys/kernel/debug/tracing/. No compiler, no LLVM, no kernel headers: write to files, read call graphs. Here's the workflow for function tracing, call-graph timing, IRQ latency, and isolated trace instances.
Your shell scripts crash. trap EXIT is why the mess does not have to survive.
The shell trap builtin intercepts signals and the EXIT pseudo-signal to run cleanup code regardless of how a script dies. Most scripts skip it entirely. Here is how to use it correctly, including the subshell gotchas and the ERR trap edge cases that bite people.

ps lies about memory. /proc/smaps_rollup does not.
RSS from ps aux double-counts shared pages and makes every process look more expensive than it is. PSS from /proc/PID/smaps_rollup gives you actual per-process memory ownership. Here is how to read it.

ss -i shows you what netstat never could: TCP internals live
Everyone knows ss -tulnp. Almost nobody uses ss -i, which surfaces congestion window size, RTT, retransmit counts, and send/receive buffer fill, directly from the kernel, no tool required.

nohup, disown, setsid: what each actually does and which one you want
Three tools for keeping a process alive after you close the terminal. They do not do the same thing. Here is the kernel-level difference, and when each one applies.

ip netns is what container networking actually is. No daemon required.
Network namespaces give a process its own routing table, its own interfaces, and its own firewall rules, in milliseconds. Docker creates them. Kubernetes creates them. You can too, from ip, without touching a container runtime.
bpftrace gives Linux what FreeBSD had in 2005. The one-liners are worth the wait.
dtrace showed up on Solaris in 2004, shipped in FreeBSD 7 in 2008, and Linux users spent the next decade pretending strace was sufficient. bpftrace is the real answer, doing dynamic kernel tracing, histograms, stack walks, zero overhead when idle.

taskset pins a process to specific CPUs. numactl keeps its memory local too.
The Linux scheduler moves processes between cores. Sometimes that churn is the bottleneck: cold cache lines, NUMA cross-node fetches, latency spikes with no obvious cause. taskset and numactl are blunt instruments that work.

Your kernel ships a CPU profiler. perf(1) is the key.
perf stat hands you hardware performance counters (cycles, cache misses, branch mispredictions) in seconds. perf record samples call stacks at full speed. Both are already installed and beat any SaaS APM for understanding CPU-bound problems.
strace -c is a profiler. Stop spraying and praying.
Most people open strace, get buried in output, and close the terminal. Four flags fix that: -c counts, -e filters, -P follows a single path, -T times each call. Here is how strace is actually supposed to work.
Your container is six clone(2) flags. nsenter gets you back in.
Containers are six kernel namespaces and nothing else. nsenter gets you inside from the host without docker exec, without touching the image, and without whatever tooling the vendor decided to ship.
socat is the Swiss Army knife you keep reaching past
netcat forwards a port. socat forwards a port, wraps it in TLS, splices it to a Unix socket, proxies serial-over-TCP, and lets you inject raw bytes mid-stream. You already have it installed. Here is how to actually use it.
dig +trace, and how to tell whose DNS is actually lying to you
"It's a DNS problem" is where debugging stops. +trace walks the delegation from the root yourself, +norecurse asks a resolver what it has cached without letting it go fetch, and together they tell you whether the bad answer is the zone, the resolver, or the client.
Your cron job is running twice and that's why the numbers are wrong
A job that usually takes four minutes on a five-minute schedule will eventually take six, and then you have two copies racing. flock fixes it in one line, and the pidfile you were about to write instead is broken in ways flock isn't.
Two uplinks, one box, and the reply going out the wrong interface
The routing table picks a route by destination. When you have two upstreams, replies to traffic that arrived on the second one leave via the first, get dropped by the upstream's anti-spoofing, and vanish. ip rule and a second routing table fix it properly.

Upgrade like you can undo it, because with bectl you can
A ZFS boot environment is a bootable clone of your root dataset. Make one before every upgrade and a wrecked kernel becomes a reboot, not a recovery-media evening. The bectl walk, and the loader trick that saves you when the new one won't boot.
Let pf keep the ban list so you don't have to
pf tables and anchors turn a static ruleset into a firewall that bans its own attackers and updates without a reload. Real pfctl commands, real persistence, real expiry, not a cron job that greps auth.log like it's 2004.

Read a wedged process with your hands, not a dashboard
A process is hung and the graphs won't say why. Here's the /proc, ps, strace, and dmesg walk that finds a stuck worker in about ninety seconds, no agent, no vendor, no login.

Your restart policy is deleting the crime scene
Automatic restarts keep services available, but an aggressive restart loop can erase the timing, logs, cores, and state needed to understand why a process failed. Preserve evidence before recovery becomes amnesia.

Stop waiting beside tcpdump like it owes you an incident
Intermittent network failures do not happen while you are watching. Use tcpdump's rotating capture files, size limits, and post-trigger preservation to keep the packets that existed before the pager fired.
Your shell pipeline succeeded because the last command was polite
A failed producer can disappear behind a successful consumer. RodHat explains pipeline exit status, pipefail, PIPESTATUS, and how to stop backup scripts from lying.

"Cannot assign requested address" is not a DNS problem. You're out of ports.
A client making thousands of short-lived outbound connections exhausts the ephemeral range, and every tuple sits in TIME_WAIT for a minute afterwards. Here's how to confirm it in one command and the three fixes, ranked by how much you'll regret them.

awk has hash maps, and that's why you don't need the Python script
Most people's awk stops at print $7. Associative arrays, END blocks and a two-line accumulator turn it into the right tool for ninety percent of the log questions people currently write a script for, and it runs on a box with nothing installed.

zfs send is the backup tool you already have and probably aren't using
An incremental zfs send moves exactly the blocks that changed, verified end to end, with no file-tree walk at all. The full replication pipeline is one command, and the resume token turns a failed 3TB transfer from a restart into a continuation.

The six rsync flags worth knowing, and the one that builds you free snapshots
-a doesn't preserve what you think it preserves. --inplace and --partial solve opposite problems and combining them wrong loses data. And --link-dest turns rsync into a deduplicating snapshot system in one flag.

Debug a TLS handshake by hand with openssl s_client
"Certificate verify failed" is four different bugs wearing one error message. s_client shows you the chain the server actually sent, in order, with the verify result per link, which is how you find the missing intermediate in about twenty seconds.

Stop your backup job from taking production down with it
nice does nothing for I/O. ionice only works on one scheduler that most systems no longer use. cgroup v2 io.latency and io.max are the two knobs that actually work, and they work on the thing you already have.

Get a real disk latency histogram in one line of bpftrace
iostat gives you an average, and averages hide the tail that's actually hurting you. A four-line bpftrace program prints a log2 histogram of block I/O latency per device, live, on a production box, with no agent and no restart.
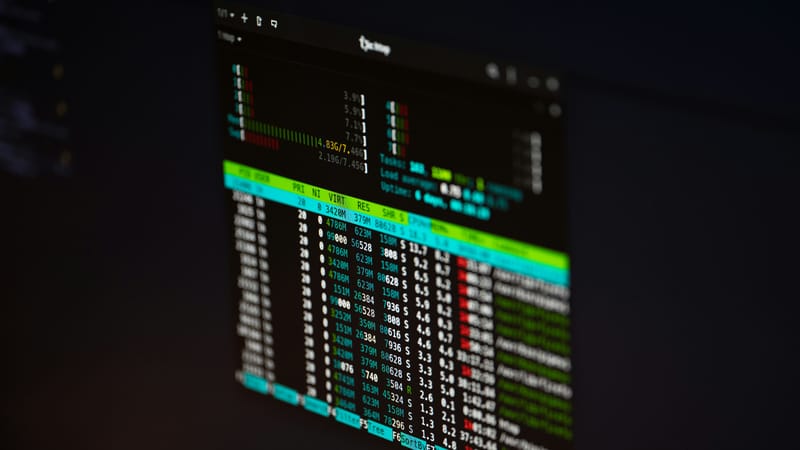
Five shell one-liners I actually use, not the ones that show up in every 'top 10' list
Real, still-in-daily-use shell one-liners for finding what's eating memory, what's holding a port, and what changed in a config file, no clickbait filler.

Process supervision is a 40-line problem. It has been solved since 1997.
You don't need a service manager with a DNS resolver in it to restart a daemon that died. daemontools, runit and s6 do supervision trees, log rotation and clean shutdown in a handful of files, and the design idea underneath them is worth stealing even if you never install one.

find | xargs is a filename injection bug you've been shipping for years
Whitespace, newlines and quotes in filenames turn the standard find-pipe-xargs idiom into something that deletes the wrong files. -print0 and -0 fix it, find -exec + fixes it better, and there's one case where only one of them works.
ZFS boot environments + jails will do 90% of what you're using Docker for, and the other 10% is the part you don't actually need
A real walkthrough of FreeBSD jails on ZFS datasets as a lighter, more honest isolation model than a container runtime for a lot of workloads.

Your ssh is reconnecting every single time. It doesn't have to.
ControlMaster reuses one TCP connection and one authentication for every subsequent session to the same host. Combine it with ProxyJump and a Match block and the difference between a 900ms hop and a 20ms one is four lines of config you write once.

No, ZFS did not eat your RAM. Read arc_summary before you tune anything.
The ARC is designed to consume all the memory you aren't using and give it back under pressure. But it does give it back slowly, and there are two real cases where you should cap it. Here's how to tell which situation you're actually in.
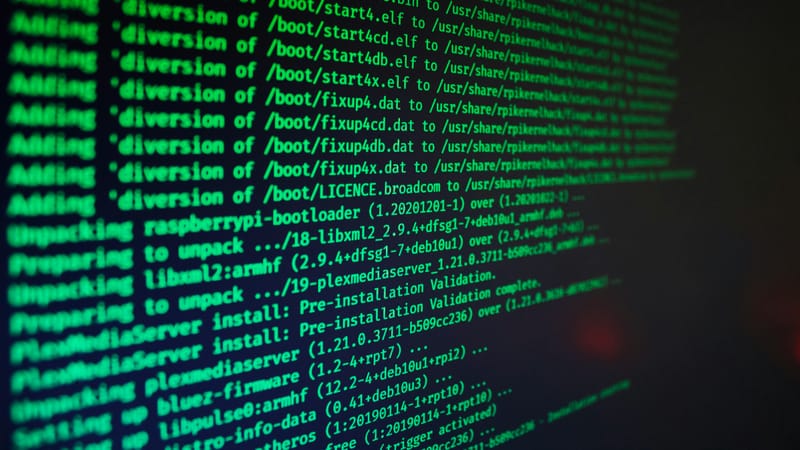
Find out which syscall is actually eating your latency with one dtrace one-liner
A real dtrace/bpftrace one-liner for finding the syscall responsible for tail latency, plus why strace -T won't get you there.

The disk is full and du says it isn't. It's an open file descriptor.
df reports 100%, du walks the whole tree and finds nothing. The space is in a file somebody deleted while a process still had it open, and the inode lives until the last fd closes. lsof +L1 finds it in one command.

Stop guessing what's listening on that port
netstat -an tells you a socket is open. It does not tell you which process opened it, which user owns it, or whether the accept queue is already overflowing. ss and sockstat do, and they take the same three seconds.